Get Accelerations from AnyShake
At present, AnyShake Explorer outputs raw sample values (counts) directly acquired from the ADC and accelerometer. It does not output pre-scaled physical quantities such as velocity or acceleration.
Therefore, engineering metrics such as PGA (Peak Ground Acceleration) and PGV (Peak Ground Velocity) must be derived during post-processing, where unit conversion, instrument response removal, and appropriate filtering can be applied in a controlled and reproducible manner.
AnyShake Explorer is designed to output raw sensor and ADC sample counts rather than pre-scaled physical units. This is because deriving physical quantities inherently depends on a chain of assumptions and processing steps, including gain settings, instrument response models, filtering, and integration methods. Once these are fixed in firmware, critical information becomes irreversible. By preserving raw counts, the system maintains maximum data integrity and traceability, allowing unit conversion, response correction, and engineering metric calculations to be performed explicitly in software. This makes the processing workflow reproducible, verifiable, and adaptable to different use cases.
Obtaining Station Metadata
Key parameters such as system gain, sensor response (poles and zeros), channel definitions, and sampling rate are fully defined in the station metadata. By loading and parsing this metadata during post-processing, raw sample counts can be accurately converted into physical quantities such as acceleration, velocity, or displacement.
The station metadata is provided as an XML file and can be downloaded from the Settings page in AnyShake Explorer:
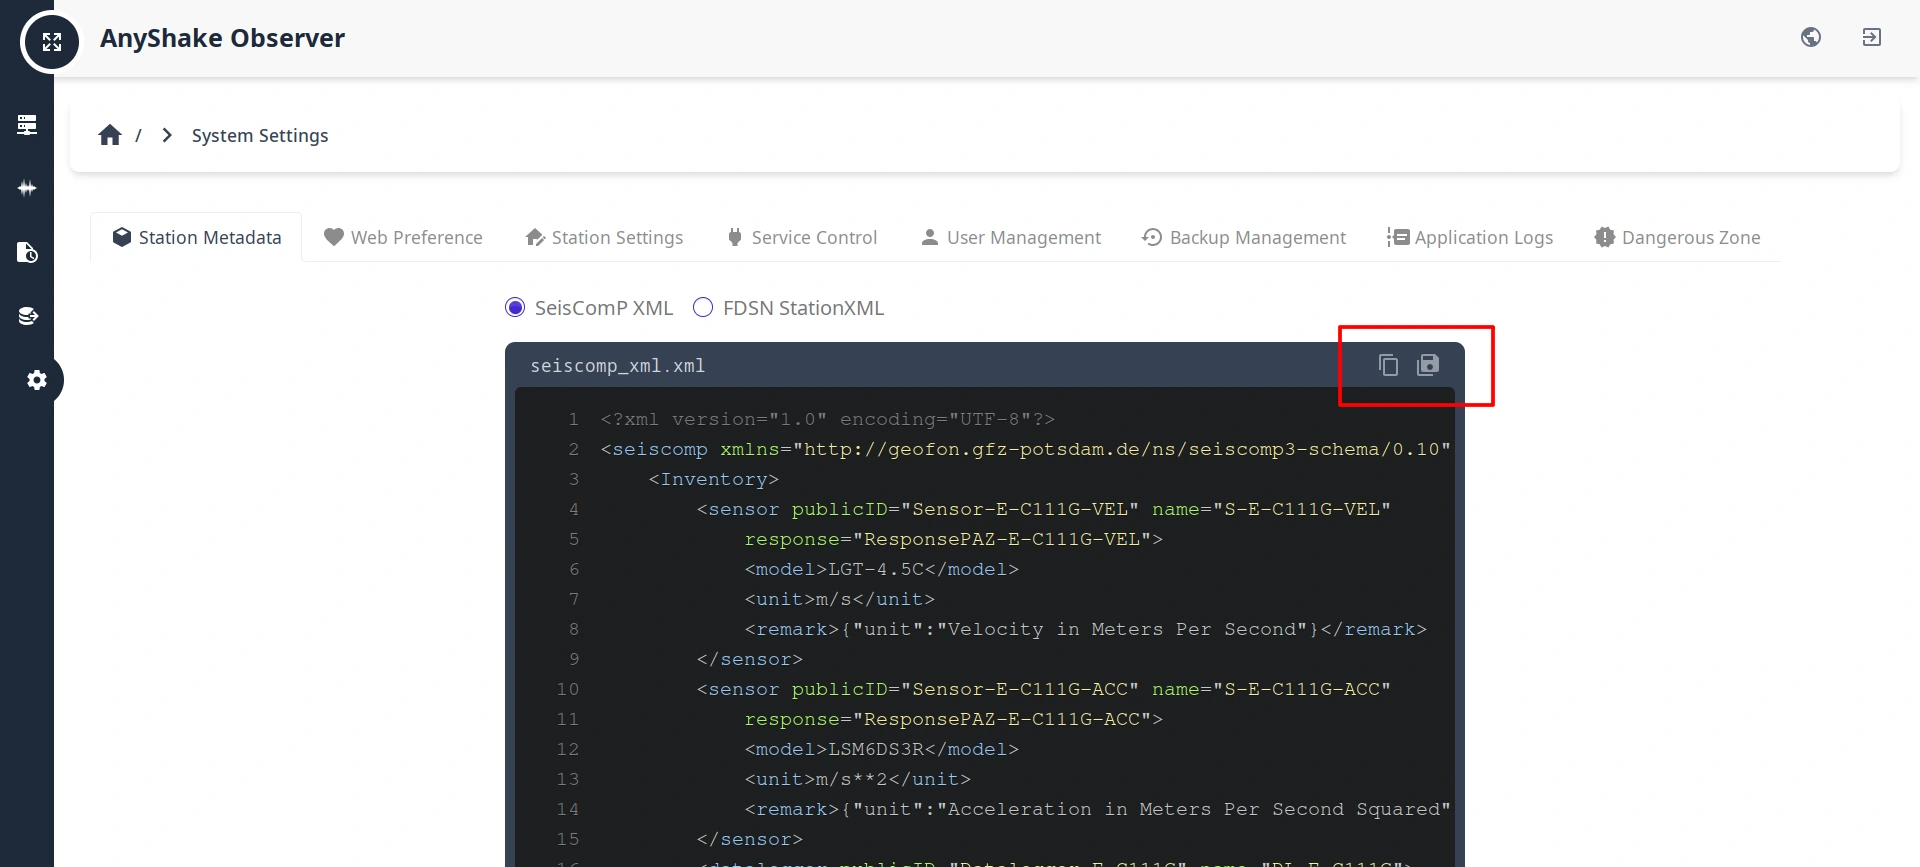
There are 2 formats are supported in AnyShake Observer:
- SeisComP XML: The native metadata format used by the SeisComP system, which is widely deployed in professional seismic networks.
- FDSN StationXML: An international standard defined by the International Federation of Digital Seismograph Networks (FDSN). It is the most widely supported metadata exchange format in the seismological community.
By default, the format is SeisComP XML. After downloading, place the metadata file in the same directory as the waveform data files to be processed.
Obtaining Waveform Data
Navigate to the History Waveform page and select the time range of interest. Then download the MiniSEED files for each channel.
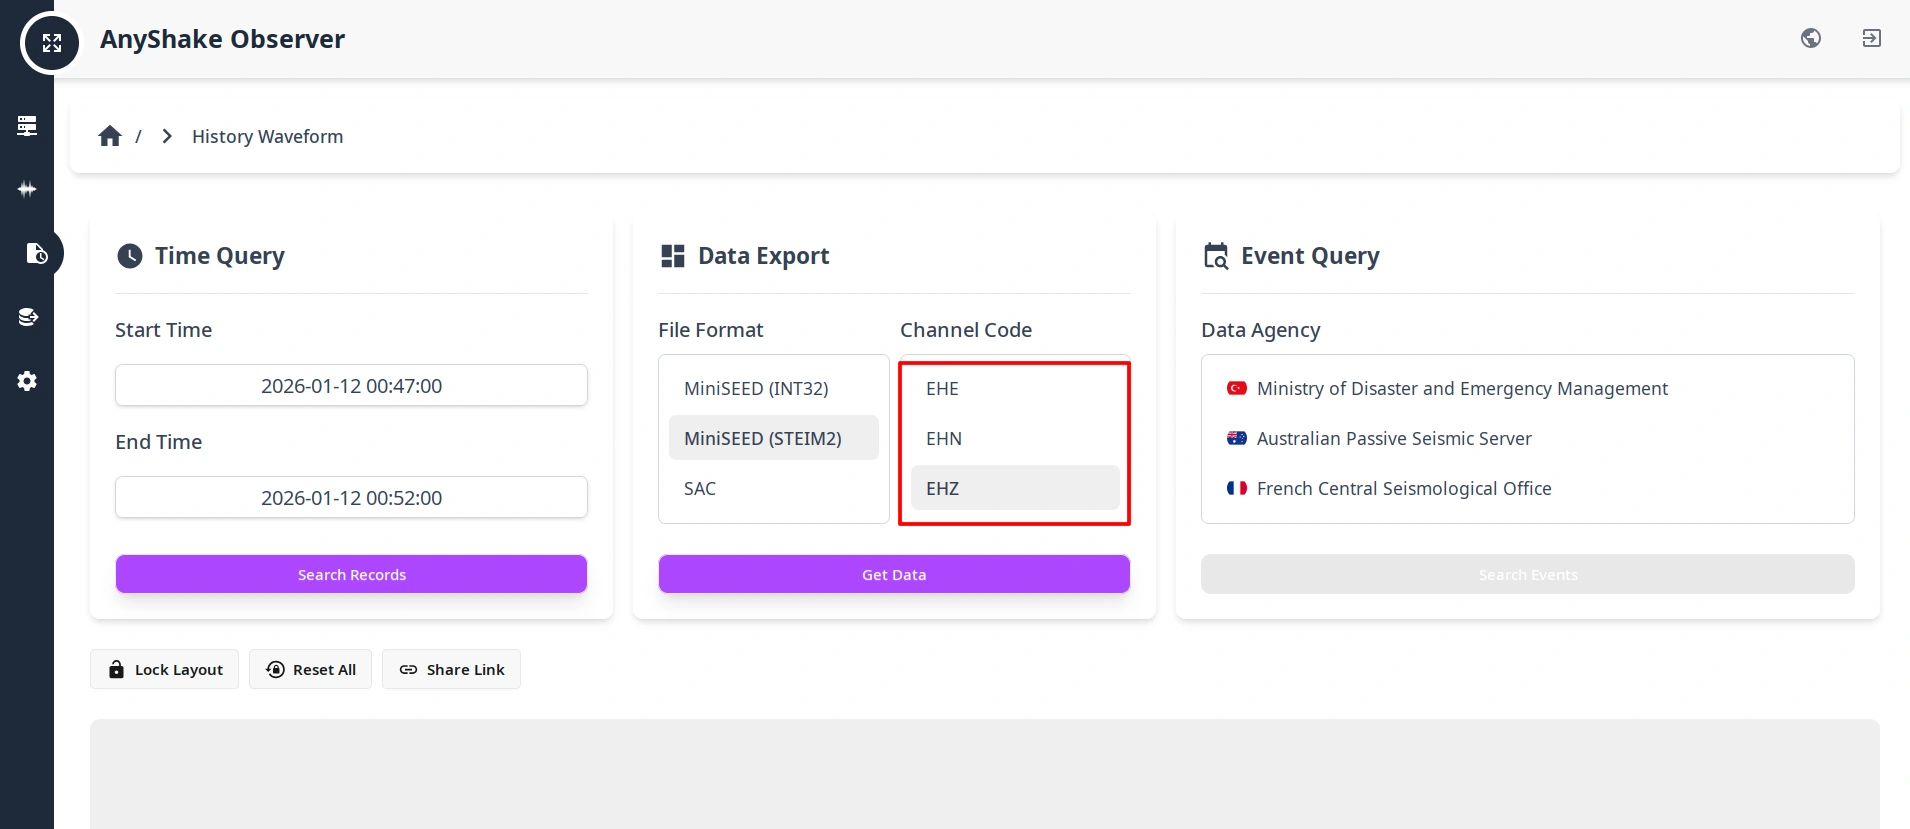
- For geophone channels, select the following channels:
EHZ(Vertical)EHE(East–West)EHN(North–South)
- For accelerometer channels, select the following channels:
ENZ(Vertical)ENE(East–West)ENN(North–South)
After downloading, place all waveform files in the same directory as the station metadata file.
When computing three-component vector quantities (PGA / PGV / PGD), the start time, end time, and sampling rate of all three components must be identical. AnyShake Explorer ensures time alignment during export, but if the data are manually trimmed or merged, this should be verified again.
Computing Engineering Metrics
The following example demonstrates a complete processing workflow using ObsPy, including:
- Reading and merging waveform data
- Detrending, demeaning, and tapering
- Instrument response removal (counts → physical units)
- Bandpass filtering
- Three-component vector composition
- Calculation of PGA, PGV, and PGD
Requirements
Ensure the following are installed:
- Python ≥ 3.8
numpyobspy
Example Script
Copy the script below, modify FILES and CHANNELS to match your data, and save it as get_metrics.py.
# -*- coding: utf-8 -*-
from obspy import Stream, read, read_inventory
from numpy import max, abs, sqrt


def main():
    INVENTORY = read_inventory("./seiscomp_xml.xml")
    FILES = [
        "./2025.358.09.42.23.0003.SHAKE.AS.00.EHE.D.mseed",
        "./2025.358.09.42.23.0003.SHAKE.AS.00.EHZ.D.mseed",
        "./2025.358.09.42.23.0003.SHAKE.AS.00.EHN.D.mseed",
    ]
    CHANNELS = ["EHE", "EHN", "EHZ"]
    BANDPASS = dict(freqmin=0.1, freqmax=10.0)

    raw_data = Stream()
    for f in FILES:
        raw_data += read(f, format="mseed")
    raw_data.merge(fill_value="interpolate")

    processed_data = {"ACC": {}, "VEL": {}, "DISP": {}}
    for i, component in enumerate(CHANNELS):
        for unit in processed_data.keys():
            data_copy = raw_data[i].copy()
            data_copy.detrend("linear")
            data_copy.detrend("demean")
            data_copy.taper(max_percentage=0.05, type="cosine")
            data_copy.remove_response(
                inventory=INVENTORY,
                output=unit,
            )
            data_copy.filter("bandpass", **BANDPASS)
            processed_data[unit][component] = data_copy.data * 100

    results = {}
    for key in processed_data.keys():
        value_arr = []
        for idx, _ in enumerate(processed_data[key][CHANNELS[0]]):
            val = 0
            for comp in CHANNELS:
                val += (processed_data[key][comp][idx] ** 2)
            value_arr.append(sqrt(abs(val)))
        results[key] = max(value_arr)

    print(">>> Peak Ground Motion (3-Component Vector Sum)")
    print(f"PGA  (cm/s/s): {results['ACC']:.4f}")
    print(f"PGV  (cm/s)  : {results['VEL']:.4f}")
    print(f"PGD  (cm)    : {results['DISP']:.4f}")


if __name__ == "__main__":
    main()
Run the script:
$ python get_metrics.py
It will output the PGA, PGV, and PGD values in centimeters.
Notes
-
remove_response()outputs values in SI units. The example converts results to centimeter-based units for engineering convenience. -
Bandpass filter parameters should be adjusted based on application, such as:
- Strong-motion engineering
- Structural response analysis
- Long-period ground motion studies
-
PGA / PGV / PGD are computed as the maximum of the instantaneous three-component vector magnitude: √(E² + N² + Z²)
-
For PGD (displacement), the low-frequency cutoff is critical; improper filtering may introduce significant drift.